Evaluation of Valley-Rainbow Interconnect Transmission Project
Executive Summary
The objective of the study is to evaluate technical as well as economical impacts to consumers, producers and in turn to the society of the proposed Valley-Rainbow Interconnect Project (V-RIP) in Southern California.§ The project consists of building a 500 kV transmission line is to improve the reliability of the system and to serve the growing electric demand in the San Diego area. Without the Valley-Rainbow Project, load growth in San Diego would have to be met from a combination of inefficient existing units and new units developed in the area. The importance of the Valley-Rainbow Project was recently highlighted at a prehearing conference before the CPUC.[1]
We use an integrated generation and transmission model, UPLAN Network Power Model (NPM) to analyze both, the physical as well as the economic consequences of proposed transmission expansions and reinforcements. LCG Consulting has developed UPLAN, which simulates both, the forward electricity market and the real-time dispatch. The forward market model develops market prices of energy and ancillary services (A/S) using rational expectation (Nash) equilibrium. For real-time dispatch, UPLAN uses an optimal AC power flow (AC-OPF) algorithm that determines nodal spot prices. A methodology was developed to value the welfare impacts of the V-RIP on consumers as well as producers of electricity using hourly nodal prices, forward market prices of A/S and OPF dispatch of generators with and without V-RIP in year 2005.
The transmission network covering the Western Interconnect incorporates all major transmission lines linking demand areas in 18 States (see Figure 1). The simulation includes current projections of WSCC loads and economic generator expansions forecasted using the UPLAN Merchant Plant Model. The outputs are hourly “nodal” prices[2] for both Northern and Southern California (as well as other locations around the WSCC), hourly generation by all generating plants in the model, and monthly and annual financial results from the operations of these plants. The evaluation of the effects on grid involves not only the economics, but also the reliability of a proposed facility, as well as the satisfaction of a proposed grid-planning criterion. As a consequence, it has to proceed on an hourly basis across the full network. Our detailed study found that the impacts of V-IRP project on consumer and producer benefits vary over time and across all locations within WSCC. The influence of the transmission upgrade alters the revenues of the generators and cost to the consumers, both positively and negatively depending on location and season.
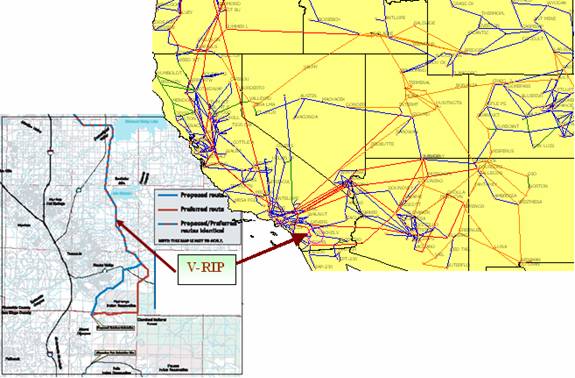
Figure 1 V-RIP and The WSCC Interconnect
Table 1 shows the total consumer and producer benefits associated with V-RIP for each month in 2005. Consumer surplus is the sum of hourly system loads multiplied by the reduction in energy prices when V-RIP is in place. In some months, consumer benefits are negative: V-RIP facilitates exports of energy outside the control area. Producer surplus is the difference in producer net incomes associated with and without V-RIP. In some months, producer surplus is negative: V-RIP facilitates the delivery of less expensive energy from outside the control area. The economic benefit of the project is the sum of the consumer and producer benefits estimated at $28 M for 2005. In a complete economic analysis of V-RIP, these gains would have to be compared to the investment costs over a project life of several years.
Table 1 Monthly Producer and Consumer Benefits for Year 2005
To determination of the temporal and spatial distribution of benefits to consumers and producers is fundamental. Therefore a model like UPLAN that simulates hourly dispatch as well as load flow is essential. A detailed study surprisingly provided results different from zonal analysis using normal import/export transportation type analysis. This is due to the fact that benefits can vary with little changes in the load flows and transmission constraints. Apparently, the contingencies, losses and load flows have a considerable amount of impact. Since Analytical tools that do not allow an hour-by-hour analysis may be misleading. Especially in the face of inter-zonal and intra-zonal congestion, the effect of V-RIP on transmission flows and prices that are charged to loads and paid to resources can change direction from one hour to the next within the same day. Indeed an analysis of hourly prices without a corresponding analysis of hourly volumes could be considerably inaccurate.
Table 2 shows that simple averages of time-of-day prices suggest a loss of consumer surplus: average prices are higher in most months, whether peak or off-peak, when V‑RIP is on the ground. This misleading and erroneous result appears because decreases in one hour are offset by increases in another hour without accounting for the different volumes to which the prices are applied.
Table 2 Average Southern California Energy Prices, With and Without V-RIP, Off-Peak, Peak, and Total, Monthly 2005*
* Note: The hourly prices are averaged across all nodes in Southern California
Finally, V-RIP may have large and different effects on market participants and/or on the grid, depending upon where loads and resources are located relative to it. For example, locational marginal prices were computed at the Devers substation, both with and without V-RIP. Table 3 shows the changes, caused by V-RIP, in generator revenues for the units at Devers, assuming that generators are paid a nodal market-clearing price.
Table 3 Generator Operating Results, With and Without V-RIP, Generators at Devers, 2005
Of course, in California, generators are not paid the nodal price. UPLAN can calculate a zonal price from energy bids within a zone. If some nodes have high nodal prices, then there could be local market power issues that are typically addressed through RMR contracts or other arrangements for local area reliability services (LARS). The comparison of nodal spot prices to zonal energy prices aids the analysis of both the likely cost of LARS arrangements, and the uplift required to support generator investments in preferred locations. In short, UPLAN is able to deliver the information needed in the design of congestion management protocols and market power mitigation measures.
The standard tools of welfare economics are well established and provide the basic framework for project analysis and policy analysis, including the evaluation of proposed simplified rules for project evaluation. The challenge in a deregulated power industry is to apply these tools, which require comparisons of delivered costs to consumers and changes in operating profits to generators, under alternative investment or policy scenarios, in the context of complex transmission networks. UPLAN integrates a model of profit-oriented plant economics with a realistic model of transmission networks. It therefore allows the tools of welfare economics to bear upon the issues associated with long-term grid planning and investment.